
I previously reviewed FieldView a molecular viewer/editor from Cresset that is designed to show molecules with their associated Field patterns and physicochemical properties. Whilst this is an excellent visualisation tool there are a couple of limitations. The generated fields are highly dependent on the conformation of the molecule, with different conformations giving different field shapes, and secondly to make real comparisons you need to be able to align the fields rather than the molecular structures.
Cresset have developed FieldAlign to do just this, given the 3D structure of your active compound and a series of active or inactive compounds (2D or 3D), optionally a protein binding site or excluded volumes can be included. The software handles the whole process. Firstly the generation of multiple conformers is automatically handled by FieldAlign, using a combination of torsion driving and high-temperature dynamics, followed by a short minimisation step to the nearest local minimum. Field points are then generated using Cresset’s method which relies on XED models of atoms and molecules, which present a more complex, accurate description of the charge around any atom. Then each of the conformations is compared with the known active and a similarity score generated.
The user can use a wizard to guide through the whole process, first select the active compound. This could be the 3D bound conformation of the ligand in the active site of the desired target or perhaps the most conformationally restricted active analogue. The user is given the option of using the protonation state as found in the file or allowing the software to assign the protonation state. This is based on a set of rules based on experimental data to determine the protonation state at pH 7.4. The advantage is the method is relatively straightforward and self-consistent. However you cannot calculate protonation states at an arbitrary pH, and there may be instances where for example intramolecular stereoelectronic effects are not well predicted. You can of course use and external package to determne the protonantion state or if you could actually measure the pka experimentally.
The user is then asked to choose a set of test molecules to align to the active reference molecule, this can be in a variety of standard chemical formats but is limited to 500 molecules. This limitation is due in part to the fact that the Field calculation code still sits in Fortran, a part of which is that you have to select a memory storage size when you compile the code (create a ‘Common Block’ to store all the molecule data during the calculations), which means there is a trade off between the ability to handle a large number of molecules and the static process size of the executable. If you want to work on larger datasets then you can split it into 500 molecule blocks, but if you are going to be regularly using very large data sets it is probably worth looking at FieldScreen a ligand-based virtual screening system, and the underlying FastQMf component, which carries out the alignment and scoring functions. FastQMF may be called as a command-line function, or may be accessed from Pipeline Pilot or KNIME as a computational node
I should note there is a minor bug when importing, any salts get added as separate entires but not surprisingly HCl does not generate any conformations so it has no impact on the subsequent calculation. I simply sorted by molecular weight and deleted the appropriate entries.
You can also optionally add a protein structure to aid alignment and identify excluded volumes.
Click Run and the the alignment proceeds, it is worth noting that FieldAlign spawns a number of local FieldEngine processes to do the actual alignment (running FieldAlign on my MacBookPro that has a dual core intel chip and looking at Activity Monitor there are two processes running called FieldEngine). The number of processes can be set up in the preferences.
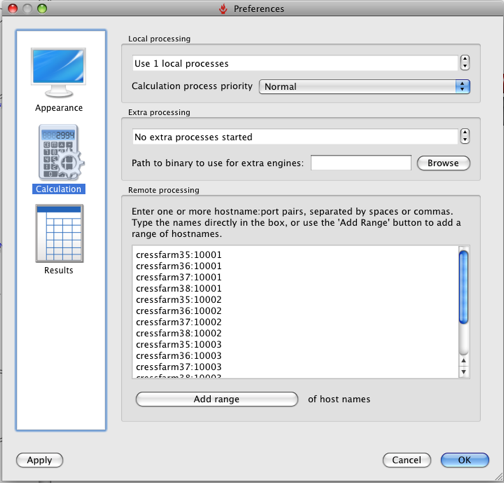
You can also set up options for remote processing: either using a cluster (e.g. Sun Grid Engine [SGE]), or using a series of remote FieldEngine tasks sitting on other machines. It should be noted however that remote tasks require a separate license from Cresset. So you can either run the calculation on a remote cluster or with 12 core desktop machines, and see exactly the same benefit in throughput. Based on my MacBookPro using the Normal settings an average alignment takes between 30 and 60 seconds, with about half the time taken on conformational sampling (this is obviously highly dependent on molecule size and number of rotatable bonds, of course) and half taken by the clique+simplex portions of the alignment itself.
The search has a number of preset options “Quick”, “Normal”, “Accurate but slow” and “Very Accurate but slow”.
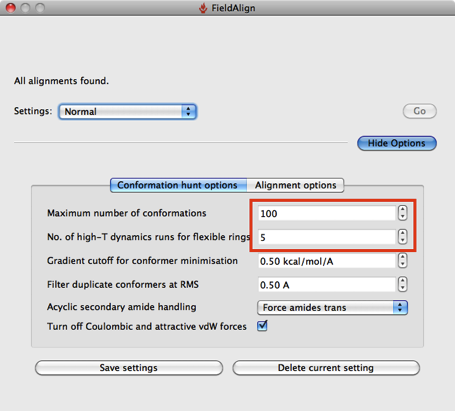
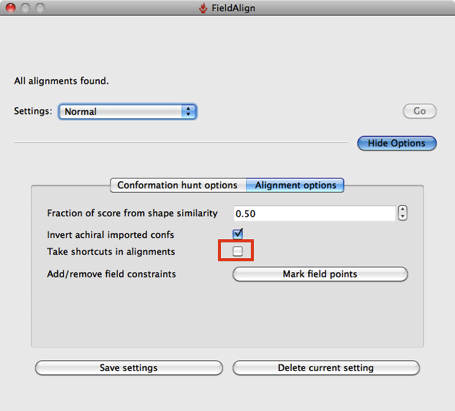
Based on a few experiments it looks like using the “Quick” option considerably reduces the conformational searching (highlighted in red above), which might not be an issue if you are simply comparing a series of substituted heterocycles. If you are looking at larger flexible molecules it would certainly be worth using the other options to increase the number of conformers evaluated, you can also edit the individual parameters by hand. The “Quick” option also use “Take shortcuts in alignments” so I suspect you may miss the optimal alignment.
Searching for a Bioisostere
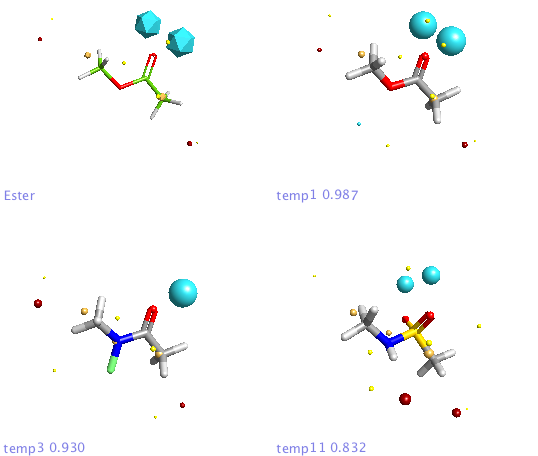
For the first experiment to evaluate FieldAlign I used the ester bioisosteres I’ve described previously and added them to around 400 small molecules (9 heavy atoms or less) from a fragment library I have built. For the query I used methyl acetate. Import was very quick and I just used the “normal” preset settings for the search which took a couple of hours on my MacBook Pro. The results are presented in a spreadsheet as shown together with columns of a number of other calculated properties (MWt, TPSA etc.) that allow sorting and filtering. You can colour the reference molecule and display the field points as desired, it is quite useful to display the field points associated with the reference molecule as icosahedron and the database molecules as spheres.
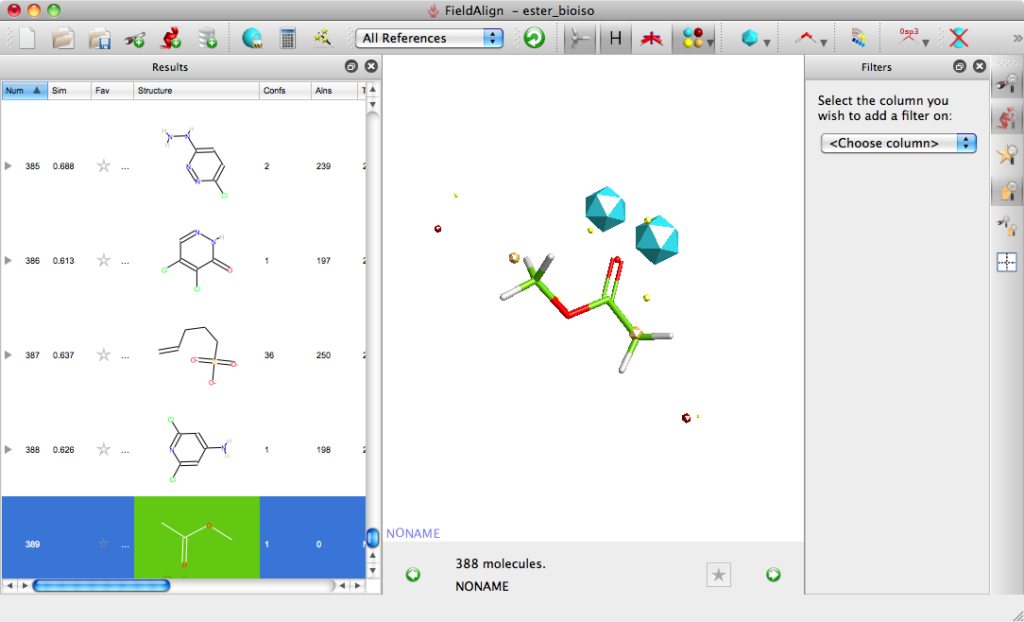
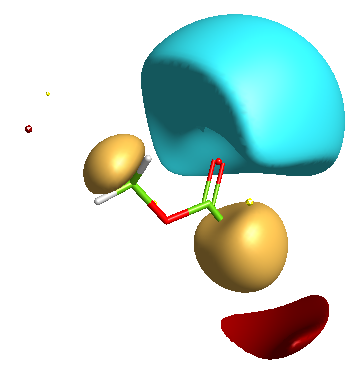
The molecules can be displayed with the corresponding surfaces negative (blue), positive (red), hydrophobic (orange). Looking at the top scoring molecules from the search several expected molecules are identified and can be displayed in a grid format.
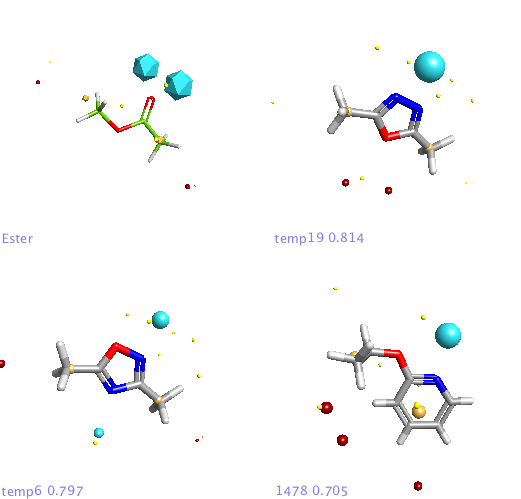
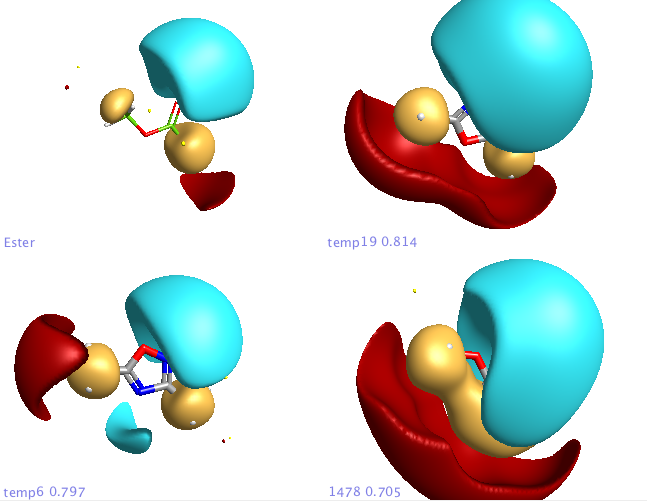
In addition a number of other potential bioisosteric replacements are identified, these include a range of heterocycles these can be compared using either the field points and/or electrostatic or hydrophobic surfaces. In this study a tanimoto similarity of around 0.7 seemed to be appropriate, it should be noted that the heterocyclic compounds would not be identified by conventional atom based searching techniques.
Screening for PDE4 leads
Whilst the above study is interesting I suspect one of the main uses of FieldAlign will be searching for potential new leads. To investigate this I took the X-ray structure of the PDE4 inhibitor Rolipram bound to PDE4 (1RO6). After cleaning and checking the structure I saved the isolated ligand and the protein as a mol2 files. I also did a quick search and identified the structures of several other PDE4 inhibitors and also three PDE5 inhibitors for comparison (Sildenafil, Tadalafil and Vardenafil). I combined these structures with a hundred of so random structures of similar size to create the search database as a sdf file.
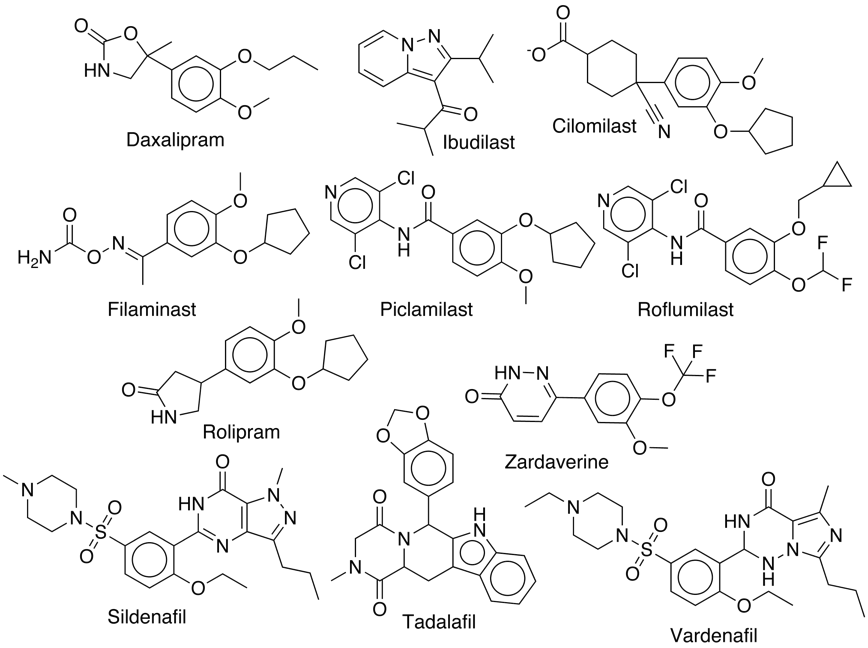
After importing the ligand mol2 file, the search sdf and the protein I ran the search using the “Normal” settings. For comparison I also calculated the Tanimotto similarity between Rolipram and all the structures in the search database using OpenBabel and MACCS fingerprints. The scatterplot below displays a comparison of the FieldAlign (similarity) with the OpenBabel (MACCS) similarity. Several features are quite notable, whilst many of the PDE4 ligands score highly for both techniques there is clearly a greater distinction between PDE4 (blue) and PDE5 (red) using FieldAlign than OpenBabel where there is actually some overlap. One compound Ibudilast is not identified by either program.
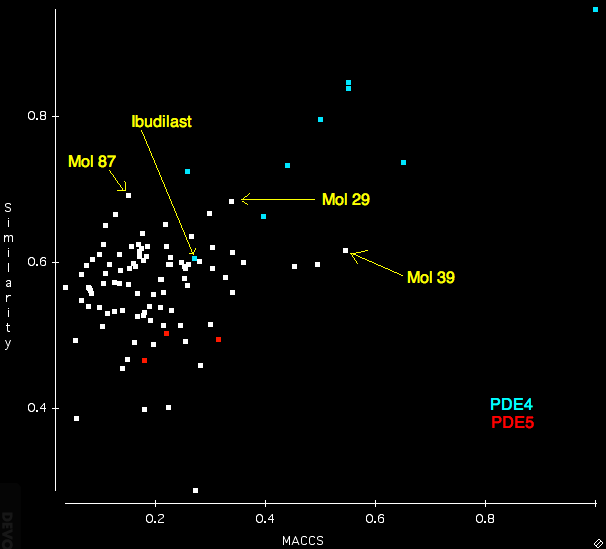
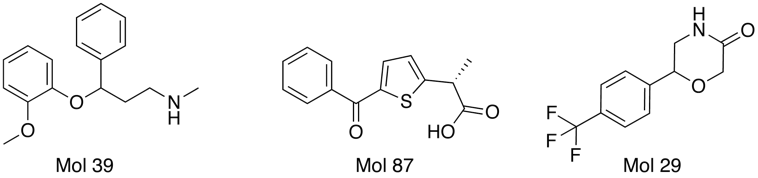
Interestingly several compounds are identified from the random molecules Mol39 by OpenBabel and Mol87 and Mol 29 by FieldAlign. (need to check activities).
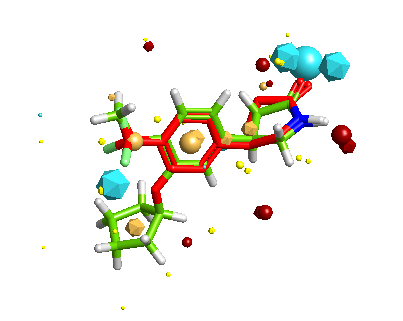
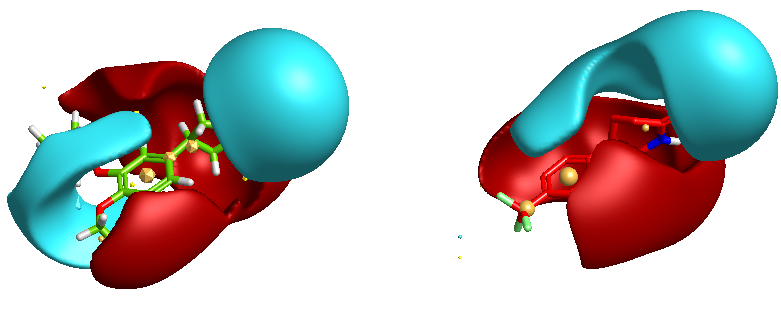
One of the nice results of the FieldAlign analysis is that unlike MACCS based scoring, you also get the alignment of the reference molecule with a low energy conformation of the database molecule. Looking at the overlay of Mol 29 (red) with Rolipram (green) below and comparing the fields it is readily apparent where the molecule might be modified to improve activity.
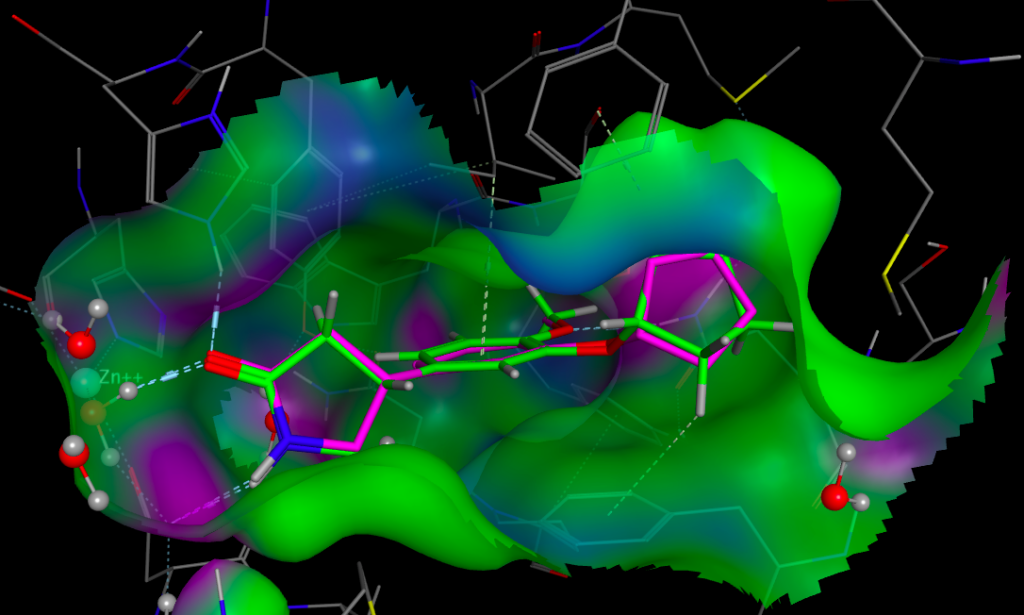
Whilst it is possible to add a solvent accessible surface to the protein within the FieldAlign display it is not currently possible to colour the surface with either electrostatics or lipophilicity or a phamacophore-like colour scheme. I included Rolipram in the search database and it was the highest scoring molecule, the image below created in MOE displays Rolipram (purple) as found in the pdb file 1RO6, in green I’ve displayed the conformation identified by FieldAlign. The results of the alignment and scoring can be exported in sdf format for import into other software packages.
FieldAlign is a very interesting tool for comparing structures and certainly offers advantages over simple atom type or functional group descriptors. Whilst the search process is slower this is offset by the ability to fully utilize multi-core machines without the need for extra software licenses. The results are usually readily interpretable by chemists and should be useful in explaining SAR and also selectivity. The 500 molecule limit precludes screening very large data-sets but Cresset offer other tools for doing that. The results can be exported in sdf format and imported into FieldView for sharing.
2 thoughts on “Review of Fieldalign”
Comments are closed.