StarDrop is an application from Optibrium that was designed to aid decision making for scientists involved in drug discovery.
During the course of a drug discovery program there are many instances where the scientist has to navigate through a mass of data, whether this be from a high-throughput screen or the culmination of an extensive lead optimisation program. In all cases there is the need to interrogate a large data-set containing many disparate data types, including chemical structures, assay data which might be a simple IC50 but could be from a complex phenotypic screen, or a series of in vitro or in vivo ADME/T assays. In many cases it may be possible to build predictive models based on the data available (or calculated) that will direct future chemistry. Under these circumstances the tradition spreadsheet applications like Excel are simply inadequate.
Several applications have been designed to meet this challenge these include Vortex, Spotfire, KNIME and StarDrop, there are many more data analysis packages but the majority do not have the ability to search or render chemical structures which is critical for drug discovery.
Installation of StarDrop on a Mac is very straight-forward and once installed you need to use the Key Installer application to get the license key from the vendor. Once installed simply double-click the StarDrop application to open it. Standard Mac shortcuts are used so “⌘O” opens a new file ( and “⌘S” saves your work), several file types are supported these include .sdf, .smi. .txt, .csv and .mol in addition to the internal file types. There is a preview dialog that allows you to check the file is being pared correctly, the import is very quick with both structures in SMILES (I generated with OpenBabel) or sdf (generated by MOE) format being rendered correctly in all my testing. Whilst .smi is as the file extension for SMILES files is supported .smiles is not currently, also it is quite common for smiles files to have data associated with each structure. The standard Daylight definition of a SMILES file contains only a SMILES string and ID, which is how StarDrop interprets a .smi file (everything following the SMILES is treated as the identifier) which means all the data gets concatenated with the name.
So
|
1 2 3 |
Clc1cc(ccc1)CN1CC[C@H](NCc2n(cnc2)Cc2ccc(cc2)C#N)C1=O ID_000001 0.21212122 17 -4.8147402 11.876264 4 1 21 4.1463838 716.25378 0 0 Clc1cc(ccc1)CN1C[C@@H](NCc2n(cnc2)Cc2ccc(cc2)C#N)CC1 ID_000002 0.21875 17 -4.64605 11.735089 4 1 22 4.6197839 715.00604 0 0 |
becomes
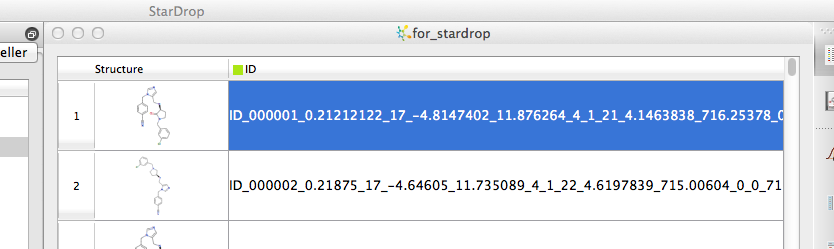
However if you convert the file extension to .txt (or .smiles) and import as text it is then imported correctly. Whilst StarDrop does not import Excel files directly is is easy to export to tab delimited text files and then import. Stardrop does not have out of the box functionality to link directly to SQL databases but the API does allow expert users to build a links.
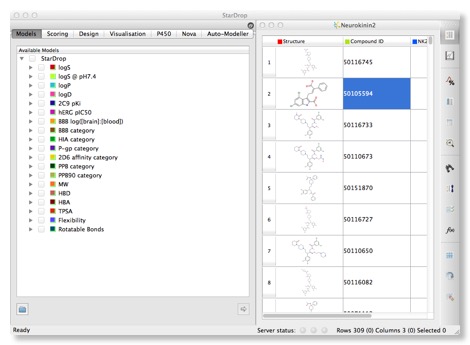
The right hand panel displays a spreadsheet containing all the data available on the compounds, the left hand provides access to models and visualisations.The structures can be a little small, particularly for complex structures, these can be expanded by dragging the column and row boundaries, however Mac users will be delighted to see that a click of a button invokes a “Screenflow” like display that makes scrolling through a list of structures a trivial exercise. It might be useful to allow the user to double click to “popout” a window giving a larger display however. Structures are colour coded in the standard fashion Nitrogen = Blue, Oxygen = Red etc. and for even complex structures the 2D layout is excellent.
Properties and models
StarDrop comes with a variety of physicochemical property descriptor calculations and an increasing selection of predictive models.
- logP – the lipophilicity of a compound, calculated using a model derived from 9000 experimental octanol/water partition coefficient values. The model was trained using 6887 molecules and the remainder used as the test set for validation giving an R2 of 0.92. Full details of the model are in the extensive Reference Guide.
- logD – The StarDrop model is based on a dataset of 857 experimental octanol/water distribution coefficient values at pH 7.4, logD7.4 (Avdeef, A. (2003). Absorption and Drug Development. Solubility, Permeability and Charge State. Hoboken, New Jersey: John Wiley & Sons). StarDrop does not attempt to predict pKa but does classify acid, base, zwitterions and neutral categories according to proprietary SMARTS definitions of substructures likely to be ionised at pH 7.4. The logD7.4 set was found to be formed of 105 acidic, 684 basic, 68 zwitterionic molecules.
- logS the model predicts intrinsic water solubility, i.e. solubility for uncharged compounds in water and is based on data from over 3300 compounds solubility in water.
- logS @ 7.4 predicts apparent solubility of ionised compounds at pH 7.4.
- TPSA – Topological Polar Surface Area is calculated based on the method described by Ertl and co-workers (Ertl, Rhodes, & Selzer, 2000). Using SMARTS atom type definitions, the authors proposed the calculation of two PSA values. ERTLNoTPSA reports the polar surface area for Nitrogen and Oxygen atoms only. ERTLSPNoTPSA reports tha polar surface area for Nitrogen, Oxygen, Sulfur and Phosphorus atoms.
- Vx – the McGowan volume (Abraham & McGowan, The use of characteristic volumes to measure cavity terms in reversed-phase liquid-chromatography., 1987).
- Flex – the flexibility index
- Number of positive, negative and overall charges. Overall charge is the number of positive charges minus the number of negative charges.
- Number of aromatic rings
- Hydrogen bond donors
- Hydrogen bond acceptors
Several ADME models are also available, these include
- HIA the human intestinal absorption model is based on a dataset of over 250 compounds for which %HIA were reported in the literature, however it should be noted that the dataset is likely to be biased towards compounds that have sufficient bioavailability to justify development.
- Brain Penetration (log [brain]/[blood]) The data set consists of 292 structures with a reported logarithm of the concentration ratio between brain tissue and plasma (log(BB))
- Brain Penetration categorical model 201 structures classified as BBB+ and BBB- that are reported in literature models.
- HERG based on 168 structures with patch-clamp IC50 values for inhibition of hERG K+ channels expressed in mammalian cells.
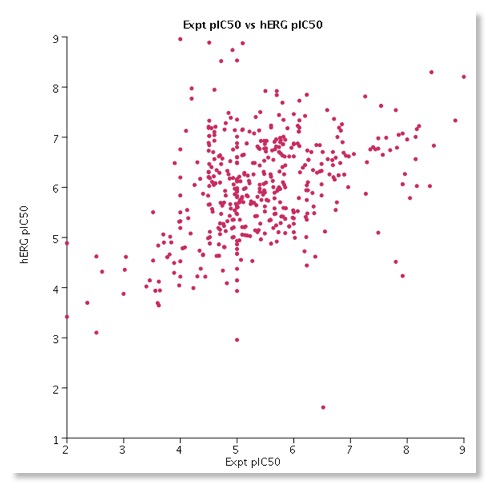
I have been culling HERG data from the literature and have a database containing over 1600 molecules with associated HERG data. For around 450 compounds I have patch clamp data and in the scatterplot below I have plotted the experimental patch clamp data versus the calculated value. Whilst there is a clear trend it also serves to underline how difficult it is to predict HERG activity for a diverse set of molecules many of which are probably outside the chemical space defined by the test set used to build the model.
Like most models of this kind they may be useful for flagging potential issues but unfortunately they only cover a limited amount of chemical space. Importantly a confidence for each prediction is reported, according to the strength of association of the compound’s descriptor values with the predicted classification. Furthermore, the distance of the predicted compound from the chemical space of the training set is calculated to gauge the confidence in the result thus allowing the user to assess potential reliability.
Calculation of properties is simply a case of clicking the check boxes for the desired properties and hitting the arrow at the bottom of the pane, the properties are automatically append to the molecular spreadsheet. The calculations are pretty quick, on my MacBook Pro (2.6 GHz Intel Core Duo, 4 GB Ram) it took about 90 seconds to calculate all the properties and models for a group of 300 regular drug like molecules.
Visualisation
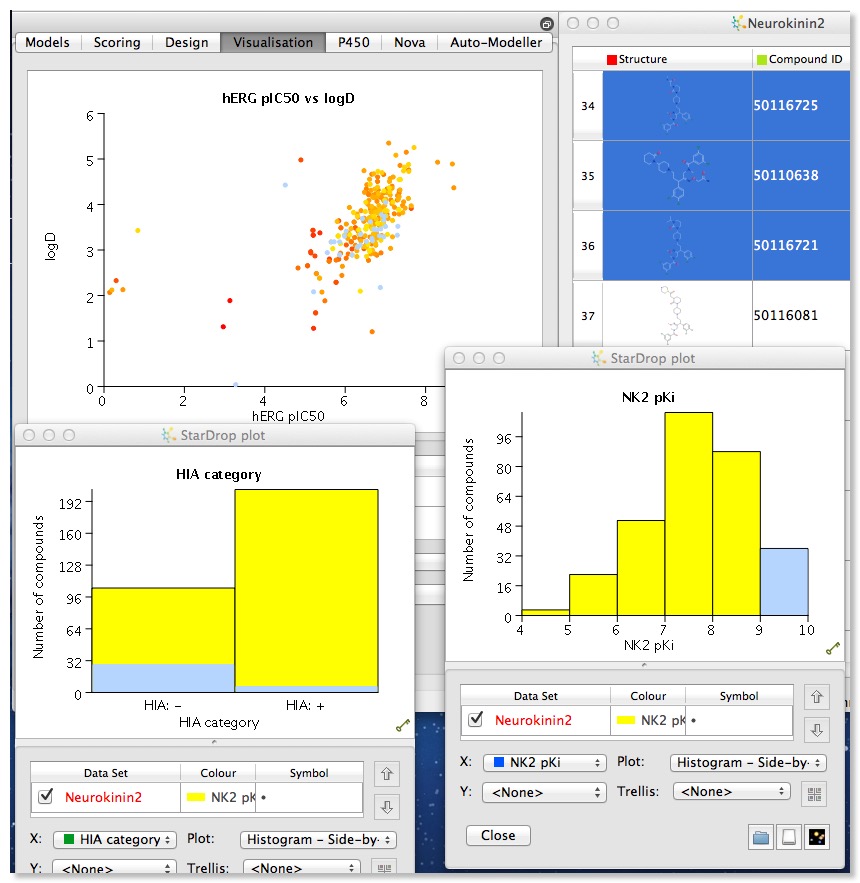
Once you have a packed spreadsheet the power of the application becomes more apparent, click on the visualisation tab and you can begin to explore the data set. It is easy to create multiple plots to compare data, and selection in one plot (in the image below I selected the most active NK2 ligands) automatically selects the corresponding molecules in al other plots and in the molecular spreadsheet.
The plot types available depend on the type of date selected, however in my testing I found that categorical data was not always recognised as such, so cluster number or number of hydrogen bond donors/acceptors (generated in Stardrop) were not identified as categorical data. However by right clicking on the column header you can edit the column. I don’t think there are options for automatically binning continuous data but using the mathematical function editor it is possible to construct a series of “if then else” loops to construct a new column that contains categories.
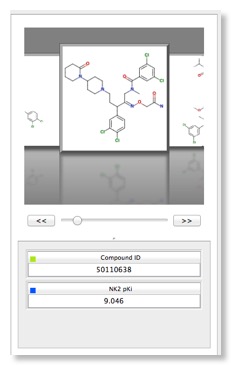
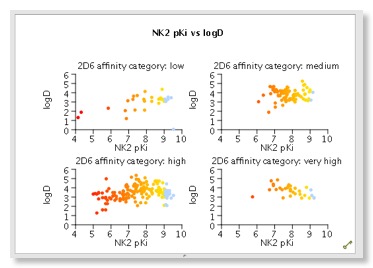
Several plot types are supported, 2D scatter plots and histograms (stacked and side by side), but by colouring points and/or using the trellis option it is possible to explore multiple properties in a single display. Categorical plots are available if comparing two sets of categorical data. There are also specialist plots relating to Probabilistic Scoring, such as a criteria histogram, snake plot and radar plot. Whilst it is possible to change the change the symbol and size you can’t add a third dimension which I must admit I find 3D rotating plots useful for densely populated plots. Hovering the mouse over a data point in the scatter plot brings up a popup window showing the structure of the molecule, which is really useful. You can modify the display but slightly confusingly this is achieved for some global options by changing the Stardrop preferences, whilst others are available from a menu available from right-clicking on a graph. At first I found right-clicking on the graph somewhat confusing, it seems clicking on an axis (or the plot itself) gives the general plot options, clicking on the values on the axis gives the options to edit the axis, whilst clicking on the axis label gives options to change font. This is probably a personal preference but I much prefer a single window to change all plot settings.
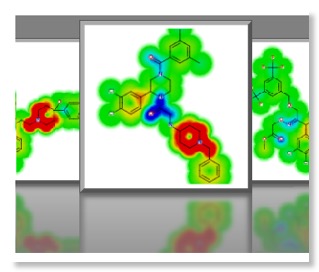
One very nice feature is the “glowing molecules” display, selecting a model results in the molecule display being rendered as a heat map to highlight the molecular features that are responsible for the activity in the model with red indicating structural features that have a positive effect in the model and the cooler blue a negative effect. So in considering the HERG model, red areas are those that are predicted to increase HERG activity and might be areas to target in future molecules.
Profiles
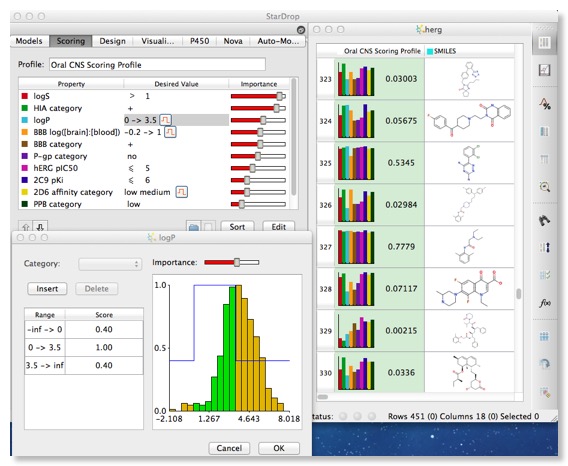
Stardrop has an interesting feature that allows you to set up a desired profile using all the experimental and calculated properties. You can set the desired value or range of values and the relative importance, this is then translated into a scoring profile and displayed in the molecular spreadsheet, together with a histogram of the property values (normalised from 0 to 1). For the low scoring compounds it is then very easy to see which property need to be improved.
I could imagine this feature perhaps being used to define the candidate profile for a particular project and be used to track progress.
Searching
Full text/numeric-based searching of all fields is available and there is also limited structure based searching.
The structure editor is simple to use but rather limited, simple rings are available but there is no facility to store templates or regularly used functional groups. You can however paste SMILES strings so you could use an external drawing package. Only simple substructure searching is available, so there is no support for wild cards, R-groups, Not-H, bond type etc. There is no support for similarity based searching.

To start a search simply click the icon containing a magnifying glass and arrow, a couple of times I clicked on the arrow icon which adds the structure to the database and I wonder if they should be further apart. The first time I ran a search it was rather slow, subsequent searches were faster. I asked if it needed to generate some kind of fingerprint index first but apparently there is a pre-processing step to generate the full molecule representation the first time a structure is accessed. Search speeds are OK on my laptop searching a dataset of 1600 drug-like molecules took 8 seconds. The results are highlighted in the table, unfortunately there is not the option to sort or hide unselected rows but you can tag the rows with a label in a new column and then use that to sort. Whilst there is no similarity search from the editor by right clicking on a row you get a menu of options, one of which is “Sort by similarity”. This will order the compounds by their similarity with the selected rows.
Nova
Nova is very interesting tool for generating and prioritising ideas, it automatically generates chemically relevant compound ideas from an initial molecule, based on a set of medicinal chemistry ‘transformation rules’ taken from examples in the literature. These are then scored using a pre-built model to identify the compound ideas most likely to satisfy a user-defined profile of required properties. The technology describing Nova is described here. Optibrium provide a Serotonin Transporter model derived from data in the CHembl database, reading in that model plus a lead compound provides the starting point for the Nova run.

Clicking on the Nova tab and starting the wizard allows you to define which parts of the lead structure are not modified, you then select the transformations are to be used. There are a wide selection of transformations to choose from and users can define their own transformation as SMIRKS a reaction transform language developed as an extension of SMILES..

You then choose the number of generations of molecules, how the generated molecules will be scored, how many to keep from each generation and any filters you might want to apply to remove undesired functionality. Stardrop then initiates the generation process, on my laptop the process took less than a minute to generate 30-40 final structures, it only appears to use a single core, apparently Nova will run each job as a single thread, using one core, but it is possible to run multiple jobs simultaneously using multiple cores. With over 200 possible transformations, running it for three generations without any limiting criteria can produce data sets with over 1,000,000 compounds – which could take a little while.
I had a few experiments using different transformations and was delighted to see that a number of known Serotonin Transporter ligands were produced!!
Modelling Data
All that I’ve reviewed above is part of the “desktop” portion of Stardrop, there is an equally important “server” side that is available on purchase of the appropriate plugin modules. This includes P450 models and auto modeller. The server side sits within a Linux environment which would normally sitting on a remote server but can be installed locally in a virtual machine. Normally the user simply needs to know the name and port number to access the models.
P450 Models
The Cytochrome P450 models are not simple QSAR models, instead 3D structures are first generated using Corina and then optimised using MOPAC97. Then an adapted version of MOPAC97 employing the AM1 method is used to simulate the chemical reaction mechanisms that might lead to metabolites. As a semi-empirical method, AM1 is known to exhibit some systematic errors. Therefore, post hoc corrections are applied which have been derived from extensive ab initio calculations. This process is of course more computationally demanding and therefore slower than simple descriptor based methods but should be transferable across different chemistries. In addition to the quantum mechanical calculation in the case of Cyp3A, 2D6 and 2C9 Stardrop applies a filter based on the knowledge of the individual isoforms active site to allow for accessibility. The calculations usually takes a few minutes for normal drug sized molecules, the results are cached on the server so if someone from the group undertakes the same calculation the cached result is available immediately. Whilst these results give a good idea of the most susceptible to oxidation they do not predict the rate of reaction, however within a series they can probably be used to rank order compounds.
In testing the model identified >70% of the known metabolites for structures with the major metabolite usually in the top three.
AutoModeller
AutoModeller as the name suggests allows expert and non-expert users to build predictive QSAR models of data. The set up of calculations is controlled by a “wizard” that takes the user through the steps required, selecting the data set and activity, splitting into training, validate and test sets, choosing descriptors and type of model. The splitting is achieved by first clustering the structures and then selecting centroids and outliers for the training set (typically 70%), and then splitting the remainder equally between validation and test sets. A variety of modelling techniques are available, including Gaussian Processes, Random Forests, Radial Basis Functions, PLS and Decision Trees. It should be noted that on large data sets some of the models may take days to complete however the user does not have to remain connected to the server, Stardrop will simply check for calculated models the next time they reconnect to the server. If you choose multiple models the one giving the best fit is highlighted as shown below. You can compare the results for the training and test sets, and then save the model. This can then be used to predict the activity of novel molecules, and can also be shared with other users.

A report can be generated that describes the model which would be useful for notebooks.

Summary
Stardrop is a very interesting application, the desktop provides useful tools for analysing data and generating a selection of important descriptors and provides a competent selection of visualisation tools but structure-based searching is limited. Linking to the server however provides an extra powerful dimension to the tool. The ability for novice users to generate models of their data will be very much appreciated by those who have been daunted by R, expert users will also appreciate being able to easily disseminate their results for use by other users. There is a scripting interface that uses Python which offers the opportunity for integrating with other applications.