If you have installed MOE from Chemical Computing Group you might not be aware that it comes with a web server that provides a web interface to a selection of web applications distributed with MOE. The server itself is implemented in Java, and requires the Oracle (Sun) Java Runtime 1.5 or later so MacOSX users will need to install Java. The minimal server hardware requirements are 2 x 4 Core Intel Xeon E5 and 16 GB RAM and 1Gb/s ethernet 1 x port card. I’m running it on my MacPro (3.5 GHz 6-Core Intel Xeon E5, 64 GB RAM) and it seems to run fine.
Assuming the server can access the MOE license server, to start the web server simply type the following into a Terminal window
|
1 2 3 4 5 6 |
MacPro:~ Chris$ /Applications/moe2016/bin/moeweb -- -- MOE/web Server (2016.0802) -- Copyright (c) 2009-2017 Chemical Computing Group, Inc. -- All rights reserved. |
You can then access the web server from a web browser at the following URL
|
1 2 |
http://YOURSERVERNAME.home:8888 |
This will open a page showing a page with various sample MOE/web applications distributed with MOE. This includes Homology Search, SD Filter, Small Molecule Properties, Structure Factor Check, Structure-Activity Report, Antibody Fragment Modelling, Database Browser, Configure Project Database.
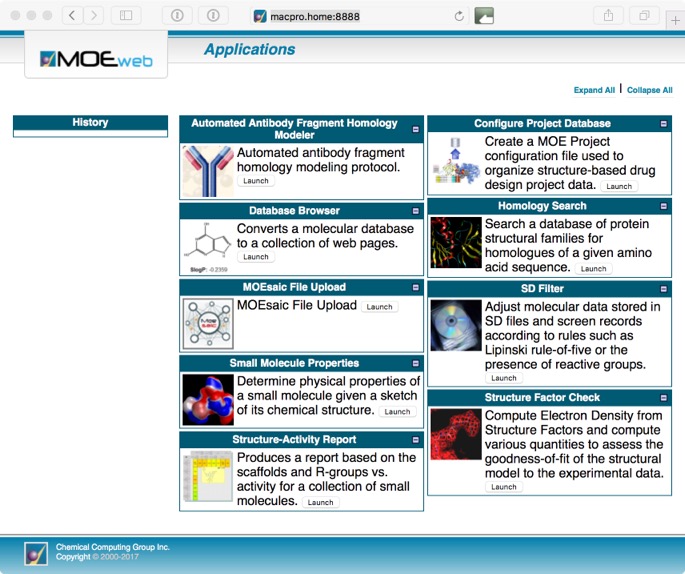
Whilst some are relatively simple (but valuable) tasks such as calculating properties or filtering a structure file, other offer quite sophisticated tools for exploring structure-activity relationships (SAR).
MOEsaic is a browser-based application for analyzing series of small molecule chemical structures and related property data (e.g. from medicinal chemistry projects). Once structure-property data is uploaded to the server, MOEsaic allows users to perform
- Substructure Search and Matched Molecular Pair (MMP) analysis.
- R-group Analysis with scaffolds defined using a built-in chemical sketcher.
- Visual analytics with property Plots and Filters.
- Virtual structure Design and Document findings with text and images.
You can either start MOEsaic from the web applications page above or directly using this URL
|
1 2 |
http://YOURSERVERNAME.home:8888/MOEsaic/ |
This opens the upload window where you can upload your own data or use one of the demo sets to explore the functionality.
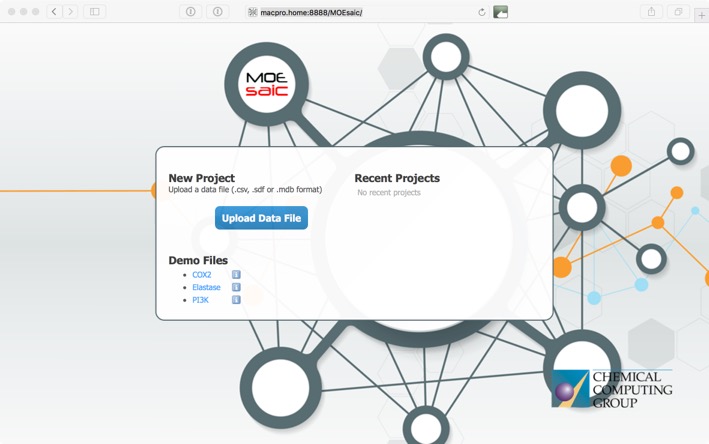
MOEsaic supports CSV (Comma Separated Values and variants that include SMILES), SDF (MDL Structure-Data File) and MDB (MOE Molecular Database) file formats. There needs to be a chemical structure field, at least one activity field. CCG suggest an upper limit of 5000 records which should be enough for most MedChem projects.
The COX2 demo data is provided in zipped csv format (cox2.csv.gz) as shown below.
ID,Structure,Series,COX2,COX1CHEMBL277115,CS(=O)(=O)c1ccc(cc1)c2sc(nc2c3ccc(F)cc3)c4ccccc4Cl,5-aromatic,7.3,CHEMBL42225,CS(=O)(=O)c1ccc(cc1)n2cc(nc2c3ccccc3)C(F)(F)F,5-aromatic,6.92,CHEMBL1682231,COc1ccc(cc1)n2nnnc2c3ccc(cc3)S(=O)(=O)C,5-aromatic,5.7,CHEMBL332251,Cc1ccc(cc1)c2c(Cl)ncn2c3ccc(cc3)S(=O)(=O)N,5-aromatic,8.52,CHEMBL1956389,CS(=O)(=O)c1ccc(cc1)n2nnnc2c3ccccc3,5-aromatic,4.52,CHEMBL443993,CS(=O)(=O)c1ccc(cc1)c2sc(nc2c3ccccc3)c4ccccc4Cl,5-aromatic,8,CHEMBL28664,NS(=O)(=O)c1ccc(cc1)n2nc(cc2c3ccc(cc3)[N+](=O)[O-])C(F)(F)F,5-aromatic,5.58,
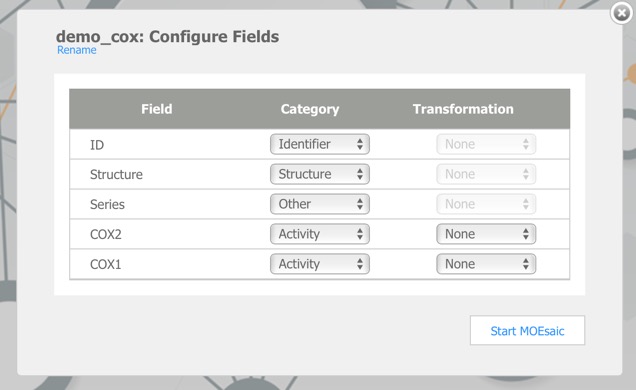
Clicking on the demo file link imports this data, dy default, the first chemical structure field is the main structure, the first character field is the structure ID and the first numerical field is the Activity field, subsequent fields may need to by categorised by hand. The COX2 dataset contains 648 records and is imported in a matter of seconds.
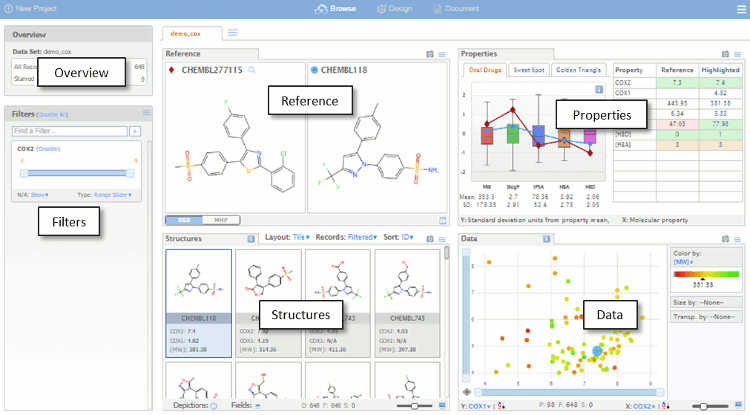
The dataset is initially imported into the default Browse view as shown below. The Browse page is divided into a number of panes which are used for visualising the data set. The different panes are linked so that actions performed in one pane affect the other panes, which automatically update.
- Overview – a summary of the data set.
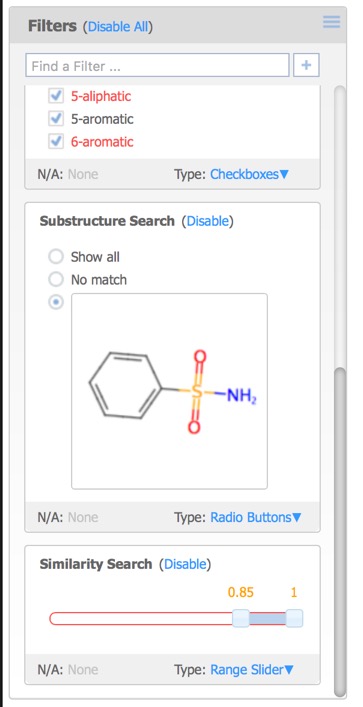
- Filters – controls for visualising a subset of the data based on fields in the original data file, property ranges or chemical substructures.
- Reference – substructure and matched molecular pair queries.
- Properties – compound profiles on various backgrounds, with colour-coded properties.
- Structures – compounds, arranged as lists or tables, that satisfy the filters and queries, background can be colour coded..
- Data – Scalable scatter plot area with colour and size coding of values.
By default the first record is assigned the reference compound, clicking on entries in the Structures pane brings the selected structure alongside the reference compound for comparison, at this point you can change the selected to become the reference compound. Throughout MOEsaic, compounds can be “starred” by a Click on the Star Icon symbol, typically displayed in the top left corner of chemical structures.
The filters pane is used to limit the structures that are displayed by means of a slider. By default the only the first activity field is added but further filters can also be added. This can include additional activity fields in the original dataset as well as calculated properties, or the selected (starred) compounds from above.
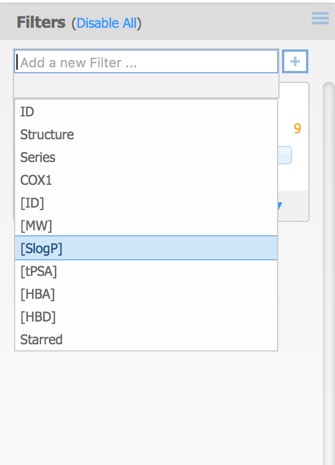
Each of the filters can be assigned different Type options:
- Checkboxes – a toggle for each individual data value.
- Radio Buttons – select exactly one data value from a list.
- Range Slider – specify a range of data values.
- Item Slider – select exactly one particular data value with a slider
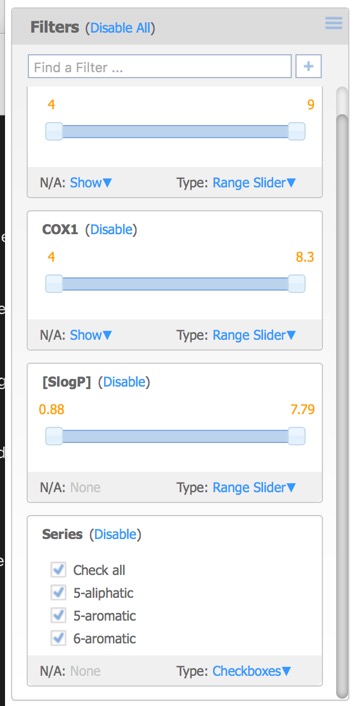
Moving the sliders or unclicking the checkboxes updates the displays in each of the panes.
Structure Based Searching
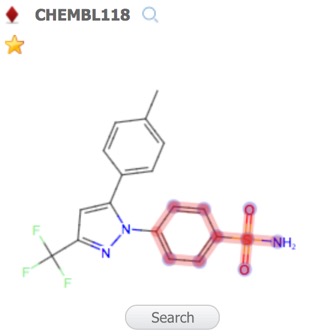
A substructure search (SSS) can be undertaken by first selecting the desired substructure in the reference compound then clicking the Search button that appears below the structure. As far as I could tell there is no lasso selection so either make rectangular selections or hold down the shift key and select individual atoms and bonds.
Alternatively you can click on the Reference pane menu to bring up a structure editor.
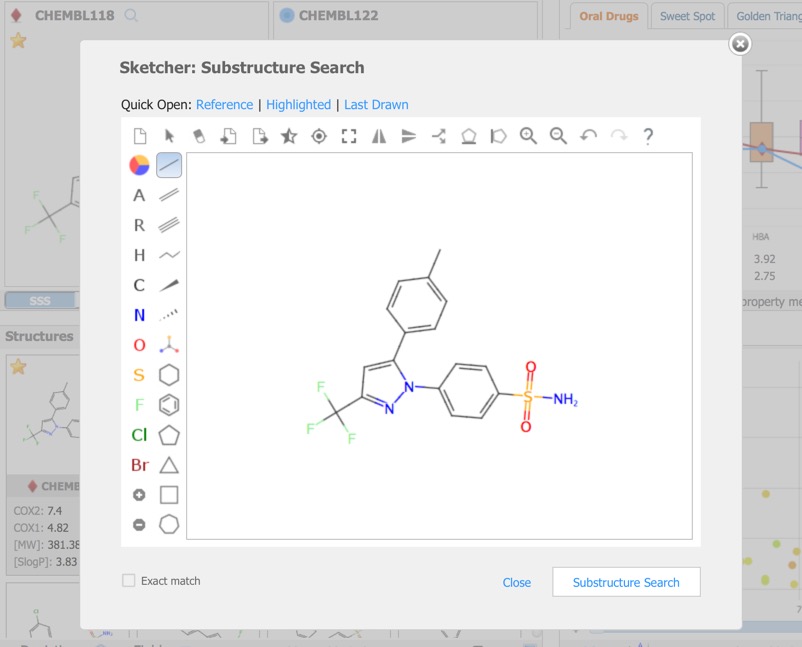
The Reference Pane menu also provides access to similarity searching. This results in a new Filter that displays the substructure, together with radio buttons allowing the user to show structures matching the selection or not, or a slider in the case of Similarity search.
Properties
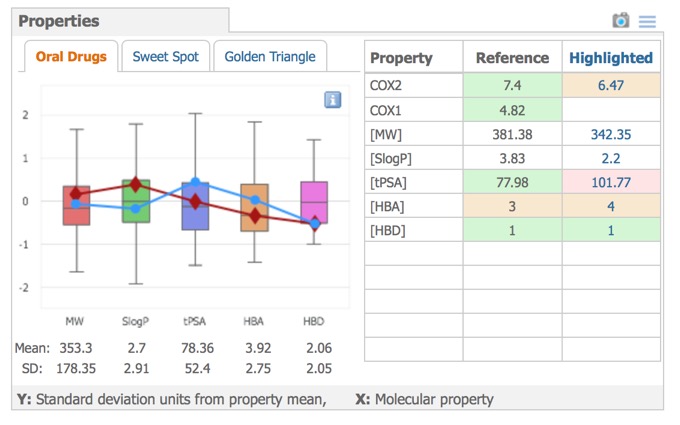
A variety of physicochemical properties are automatically calculated and these are used to comparison in the Properties pane, the left side shows graphical property models selected by the tabs above the graphic: Oral Drugs (rule-of-five type statistics), Sweet Spot (molecular weight vs. logP) or Golden Triangle (molecular weight vs. logD). The right side shows the properties of the reference compound compared to the currently selected compound.
Plotting Data
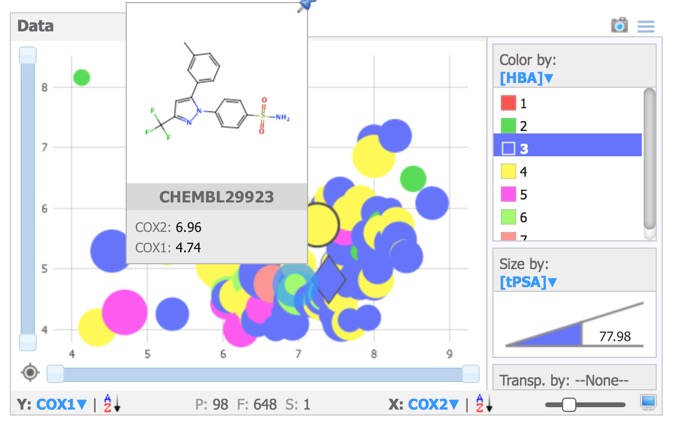
The Data pane prides a simple plotting area, giving access to x,-scatter plots of numerical, categorical or substructure data. Selected compounds are highlighted in the scatter plot and structures selected in the scatter plot are automatically highlighted in the other panes. Data points can be coloured or sized by property.Hovering over any point brings up a “tools tip” box that can be configured to display structures and/or data.
Matched Molecular Pairs
Matched Molecular Pairs (MMP) can be defined as a pair of molecules that differ in only a minor single point change. Matched molecular pairs (MMPs) are widely used in Medicinal chemistry to study changes in compound properties which includes biological activity, toxicity, etc. which are associated with well-defined structural modifications. IN MOEsaic licking on the MMP tab allows the user to select a point of variation and all matched molecular are automatically selected in the dataset. This is a very powerful way to identify key points of interaction, in particular activity cliffs. It is attractive to medicinal chemists because it is a readily interpretable model.
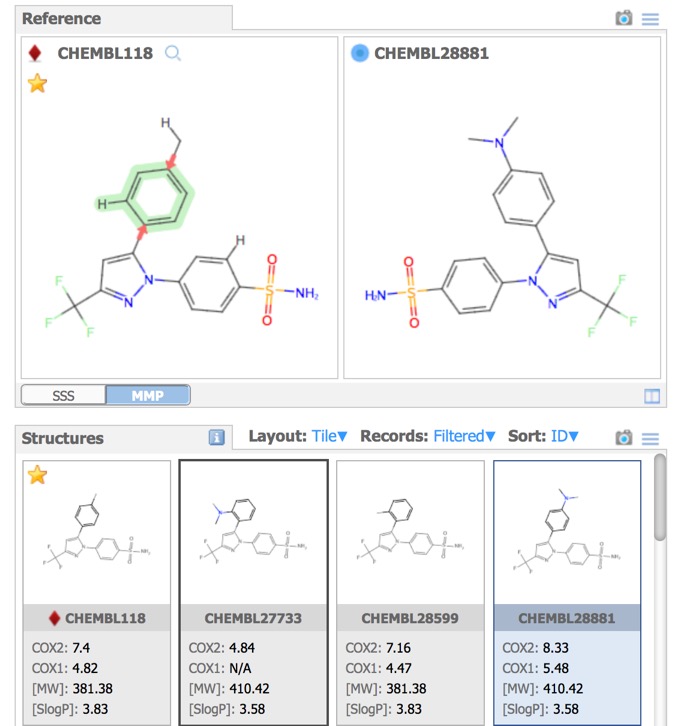
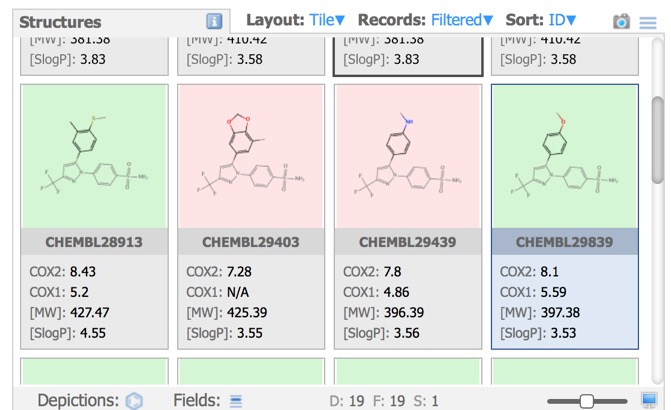
Structures Pane
In the image above all the structures have the same background, however the Depictions button allows colouring the background based on a property as shown below.
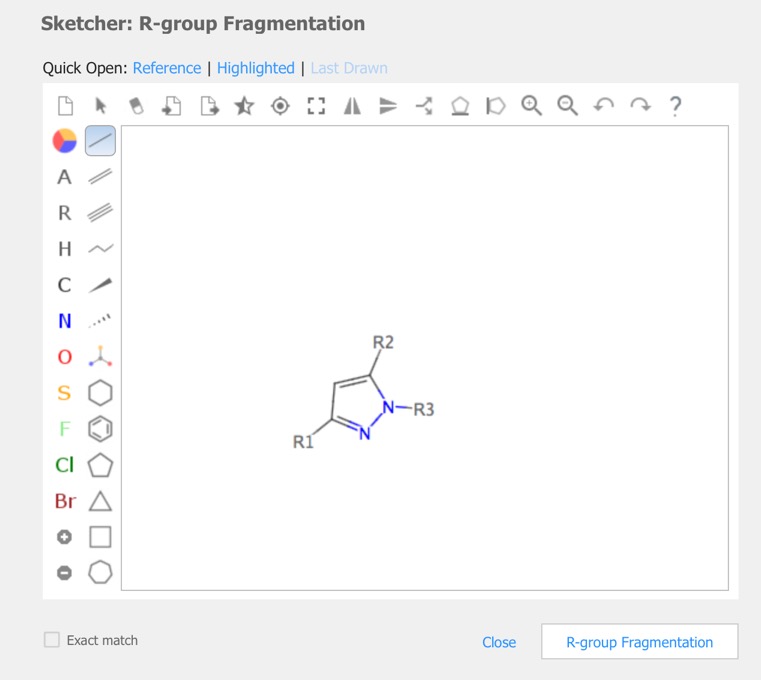
R-Group analysis
In cases you have a set of structures that are built on a common or similar scaffold, by attaching different groups at one or more points on the scaffold, you might want to see the properties of the structures as a function of the groups at the various attachment points. The query is constructed in the sketcher.
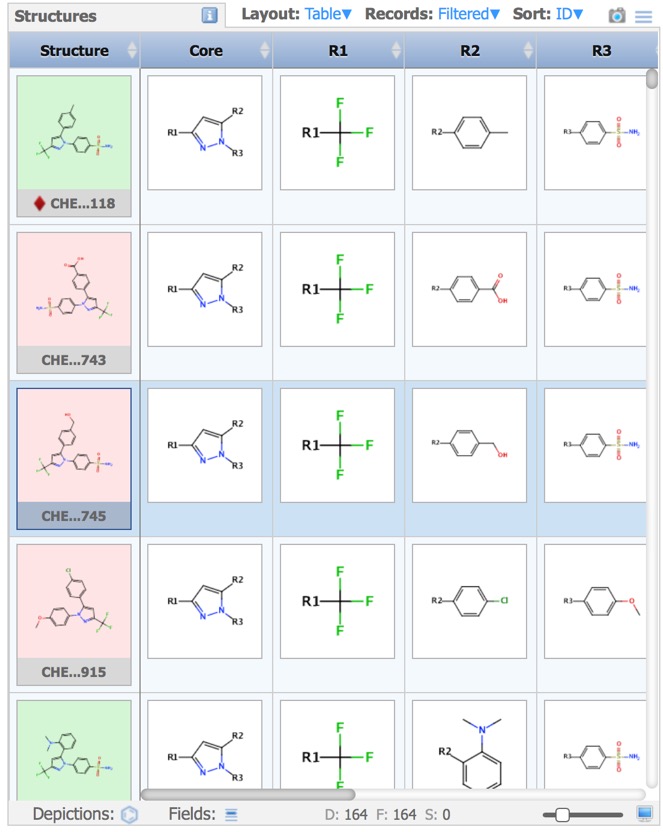
The results are then displayed in the Structures pane.
Design and Document
In addition to browsing the data set the “Design” tab allows the user to capture ideas for new compound ideas. All the components work in the same way in both Browse and Design, except that on the Design page, the displayed structures are from the Design database instead of from the uploaded data set. The “Document” tab provides for creating note-style documentation/reports regarding findings in MOEsaic, it is easy to add structures and screenshots of panes to the report using the “Send to Document” option within the “Browse” interface.
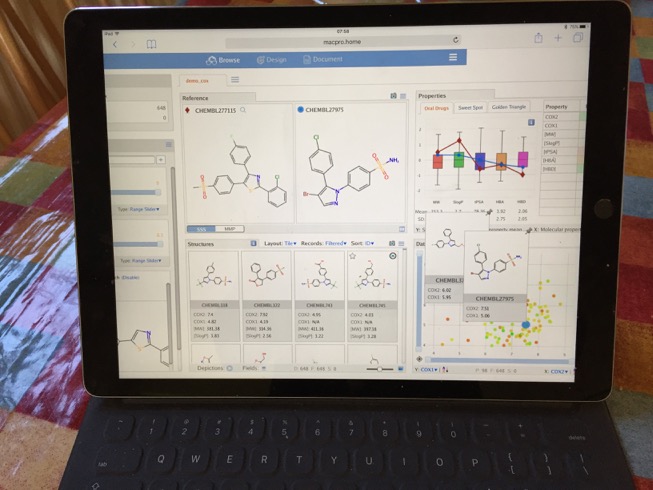
Mobile MOEsaic
I also tried viewing MOEsaic on my iPad Pro, whilst I did not undertake extensive testing all seemed to work as expected. There were a few minor issues, the page did not scale exactly to the size of the screen so it required a little scrolling. The touch input did not always work as expected, trying to use sliders simply moved the window. Also when I logged in I appeared as a new user so could not access previous work, there may be a way of tracking users but I could not find it.
Summary
MOEsaic nicely demonstrates the sophisticated analysis that can be achieved within a web browser interface, it offers simple structure based searching as well as more sophisticated tool such as MMP and R-group analysis. The interface allows users access to a number of simple plotting and analysis tools. It would be useful to have a means to share an analysis by emailing a link perhaps. The ability to easily create a report is a useful feature.
As far as I can tell much of the functionality is written in javascript, I guess in theory it should be possible for users to modify and extend this functionality but I could not find any documents describing the api.
The ability to view the data on mobile devices is likely to be more important in the future.
Latest updated 7 March 2017