
DataWarrior is a data analysis tool that understands chemistry, it provides an efficient way to search, sort and analyse structure-activity data. DataWarrior was developed at Actelion and it is highly integrated into the drug discovery platform, in 2014 it was decided to release DataWarrior without the integration layer as a stand-alone tool to the public. DataWarrior is a Java application and thus is cross platform.
Importing Data
Whilst DataWarrior has its own preferred file format (.dwar) it can also import the industry standard .sdf file format (as well as delimited text files), however it does not import compressed sdf files (.sdf.gzip)
Whilst you can export in sdf format there are several advantages to using the .dwar format because in addition to storing the data it also includes visualisation information including:
- Which views are visible, how they are arranged and what they display
- Which filters are visible, how they are configured and, thus, which data rows are visible
- Which row lists are defined and which rows belong to them
- An HTML based text describing the file’s content
- Column related description of how to interpret a column’s content, e.g. lookup URLs
- Cell related detail data like formatted text and images
- Keys and links for on-the-fly retrieval of cell related detail data from external sources
- Hidden columns with molecule data such as descriptors and atom coordinates
The .dwar format is text based so you can open it in a text editor such as BBEdit.
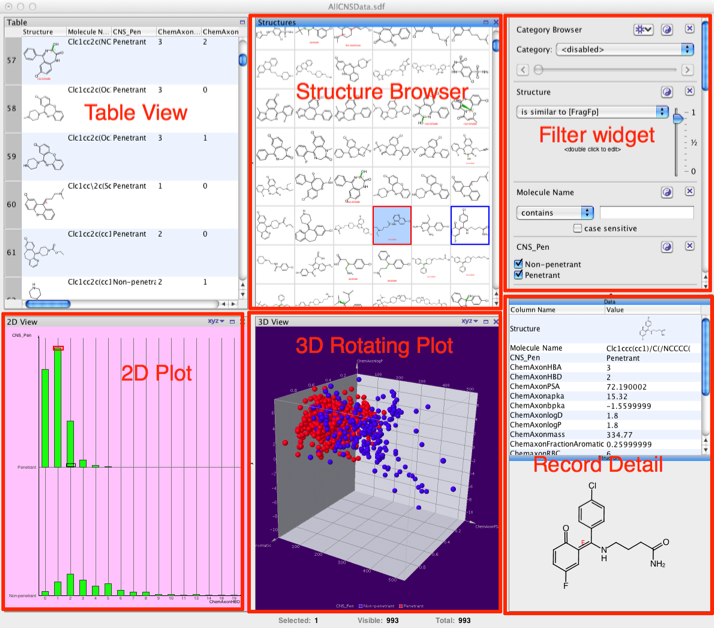
When you first import a sdf file the data appears in a default view that can be modified to suit your needs. The default display contains many different views of the data as shown below, there is a table view that includes the structure with all the associated data fields, a structure browser for rapid browsing, a widget for filtering based on structure or properties. There also a number of plot options, a wide range of 2D plots are available as are interactive 3D plots. The record detail view displays the all the data for the selected record. According to the help you can import from a database but I could not find how to do this so it might not be an option for the Open source version. After using the latest version of Mac OS X one thing that does strike you is how much space scroll bars take up 😉
Viewing your data
The Table View rows can be sorted, and data of individual cells can be modified, and display options for individual columns can be changed by clicking on the column header, this includes categorical colouring. The Table View cannot be removed and there can only be one Table View, there is the option view the table as a form. By right-clicking on the structure you get the option to copy as the structure, SMILES or compound ID.
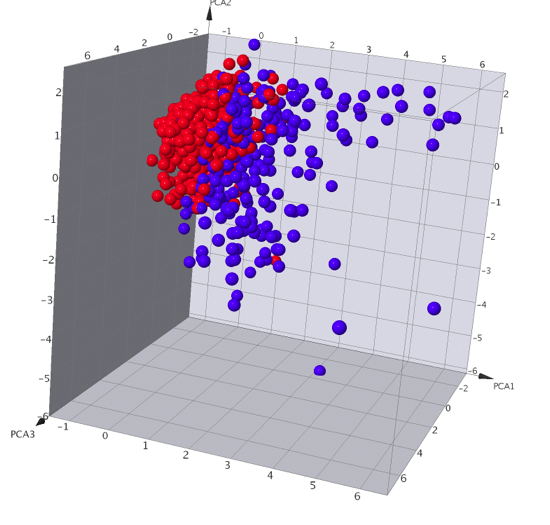
The graphical 2D- and 3D-Views are potentially the most interesting. The xyz button on the view’s header area opens a drop down menu for defining, which property is to be assigned to each axis. Columns that don’t contain numerical values, date values, category information or chemical descriptors cannot be assigned to axes and, therefore, don’t appear in the column menus. Columns with incomplete data, i.e. with some empty cells, appear in red colour indicating that some rows of the data may not be shown, if this column is selected. Non-numerical category columns appear in blue colour, while complete numerical or date columns are shown in black, there does not appear to be an option to set the data type (sometimes people put a greater than symbol in what should be a numerical field and it gets read as text). I found the interactions very responsive even when display several thousand data points. Points selected in one plot are automatically highlighted in the other plot. You can change the chart type by simply right-clicking in the chart area. One nice feature is that if you right-click on a datapoint there is the option to use the associated chemical structure as a filter. It might be useful to have the reset all filters option added to the end of the drop down list when you right-click though.
Filtering the data
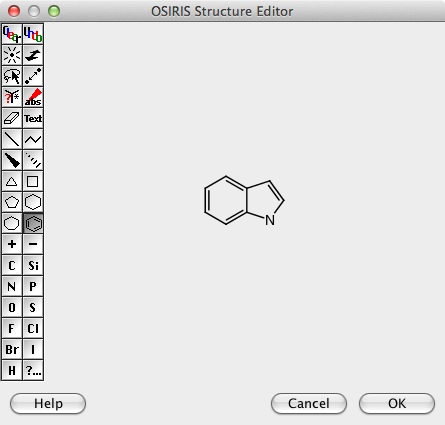
The filter widget provides a means to search and filter on all the data fields and the molecular structures. Double clicking on the structure search area opens up the Structure Editor, I have to confess I think it looks pretty ugly (and I don’t think you can use an other package) but it does have most of the functionality you might need, however I could not paste structures generated by other chemical drawing packages or SMILES/SMARTS strings. You also can’t change the size of the Structure editor window. There are no templates and I could not find an option to add project specific templates.
It took me a while to work out how to construct more complex queries, first draw the structure then select the lasso toll and double click on an atom or bond.
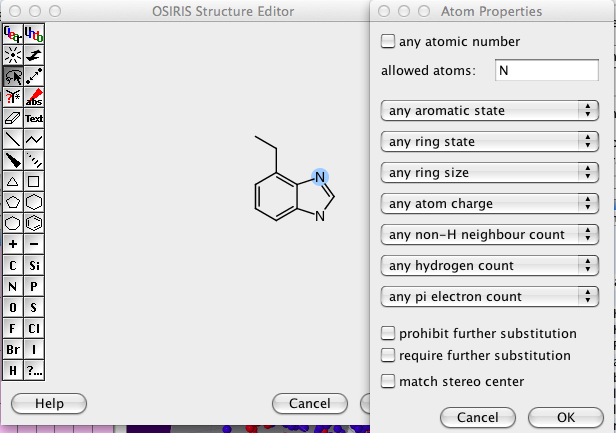
I would have preferred to have also have the option for disallowed atoms, and the option for allowing/disallowing functional groups.
Once a substructure search has been completed the substructure is highlighted within the structures. It is also possible to conduct similarity searches.
DataWarrior’s default descriptor FragFp is a substructure fragment dictionary based binary fingerprint similar to the MDL keys. It relies on a dictionary of 512 predefined structure fragments. These were selected from the multitude of possible structure fragments by optimizing two criteria: All chosen fragments should occur frequently within typical organic molecule structures. Any two chosen fragments should show little overlap concerning their occurrence in diverse sets of organic compounds. The FragFp descriptor contains 1 bit for every fragment in the dictionary. A bit set to 1 if the corresponding fragment is present in the molecule at least on time. In about half of the fragments all hetero atoms have been replaced by wild cards. This way single atom replacements only cause a moderate drop of similarity, which reflects a chemists natural similarity perception.
There are several other descriptor options.
The PathFp descriptor encodes any linear strand of up to 7 atoms into a hashed binary fingerprint of 512 bits. The PathFp descriptor is conceptually very similar to the ‘folded fingerprints’ that software of Daylight Inc. uses for calculating chemical similarities. The SphereFp descriptor encodes circular spheres of atoms and bonds into a hashed binary fingerprint of 512 bits. The SkeletonSpheres descriptor is related to the SphereFp, but also considers stereochemistry, counts duplicate fragments, in addition encodes hetero-atom depleted skeletons, and has twice the resolution leading to less hash collisions. It is the most accurate descriptor for calculating similarities of chemical graphs. On the flip side it needs more memory and similarity calculations take slightly longer. The OrgFunctions descriptor perceives molecules with the focus on available functional groups from a synthetic chemist’s point of view. It also recognises the steric or electronic features of the neighbourhood of the functional groups. It perceives molecules as being very similar, if they carry the same functional groups in similar environments independent of the rest of the carbon skeletons. The Flexophore descriptor allows predicting 3D-pharmacophore similarities.
Calculating Properties
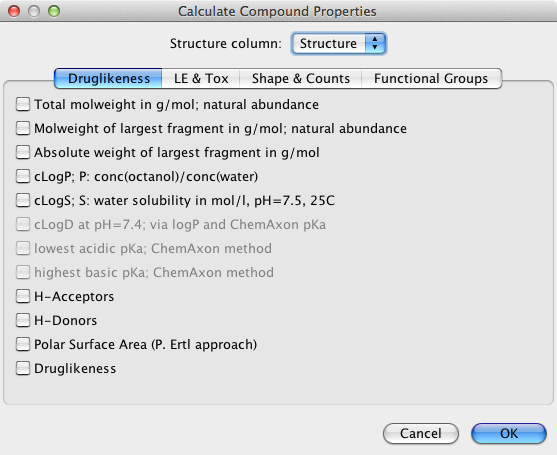
DataWarrior can be used to calculate a wide variety of properties as shown below. The ChemAxon tools were greyed out for me even though I have a valid license key and I could not find how to activate them.
The chosen properties are then added to the end of the table. I could not find any way to calculate further properties or descriptors using an external software package, and I don’t think there is any scripting support.
Data Analysis
A number of data analysis techniques are available these include Principle Component Analysis, Self-Organizing Maps (SOM) also called Kohonen Maps, Activity Cliff Analysis and automated SAR analysis. I did not have time to test all the different techniques but this seems a pretty good selection, having a matched pair analysis might be a nice addition.
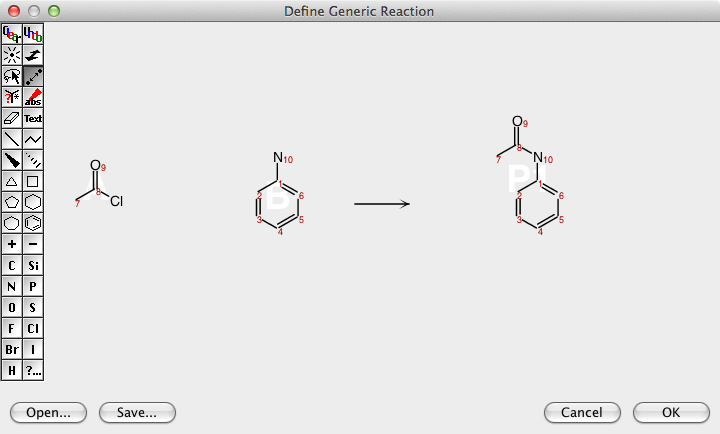
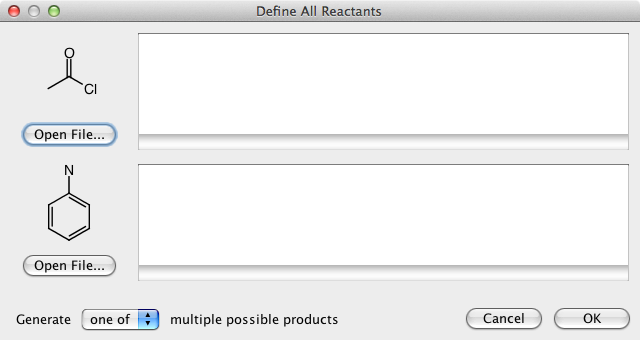
Combinatorial Chemistry
DataWarrior can be used to generate all structures of a virtual combinatorial library if a generic reaction is drawn and for every generic reactant a list of real reactant structures is provided.
Large Data Sets
I thought it might be useful to see how DataWarrior handles large data sets, I downloaded ChEMBL 19 (1.4 million structures) as an sdf file and imported it into DataWarrior. It took 5 minutes to read the file and 13 minutes until all the descriptors had been calculated and it was possible to run any structure based searches.
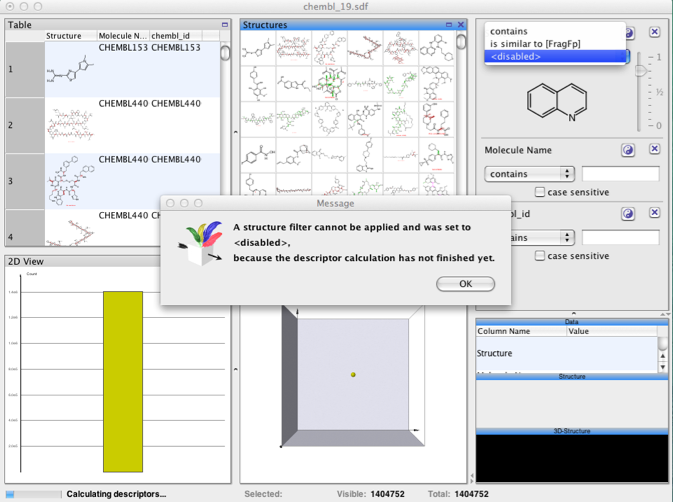
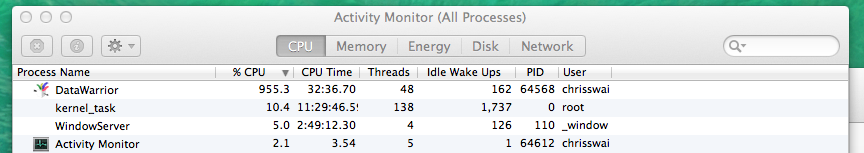
I was delighted to see that DataWarrior made good use of the multiprocessor support in my MacPro!
Once the descriptors were calculated substructure searching was done very quickly.
Support
There is an extensive help document packaged with the application and there is a Support Forum but it does not seem to be very popular yet, support is of course always an issue for non-commercial software. There is an excellent workshop on the RSC CICAG YouTube channel.
Summary
DataWarrior is an excellent piece of software for exploring structure-activity studies or investigating chemistry based data-sets, as with all non-commercial products it will be interesting to see the support the product gets from the user community.
Last updated 4 August 2014