Whilst the Mac has an increasing share of the Biology or Physics desktop, expansion in Chemistry has been limited due to the availability of key applications however it seems the situation is slowly changing. Vortex is a new chemically aware data analysis tool from Dotmatics that is now available for MacOSX. Vortex can import files in a variety of formats, it provides depiction and structure based searching, together with property calculations tightly integrated with excellent charting and analysis tools. Whilst there are a number of statistics and data analysis applications available for MacOSX none have any chemical intelligence, in particular the ability to render chemical structures, the ability to calculate chemical and physiochemical properties based on the structures, and most importantly the ability to search based on chemical structure or sub-structure.
For this review of Vortex I’m using a data set of compounds that I’ve been compiling from the literature that have activity at the hERG (human Ether-a-go-go Related Gene, iKR, or KCNH2 in the new nomenclature) ion channel, activity at this channel may lead to Long QT syndrome causing potentially fatal cardiac arrhythmia. It consists of about 850 unique molecules for which we have the structure, affinity for the channel, and a range of physicochemical properties calculated using MOE together with about 200 functional group flags calculated using Checkmol. Importing the 7 MB file took just a few seconds and the display looks like this. In addition to opening a file containing structures (sdf, SMILES) Vortex comes with JDBC drivers to interface with Oracle, SQLServer or MYSQLdatabases. This does more than just let you type sql, it actually provides a list of tables/views and builds a dynamic query form for you to grab data.
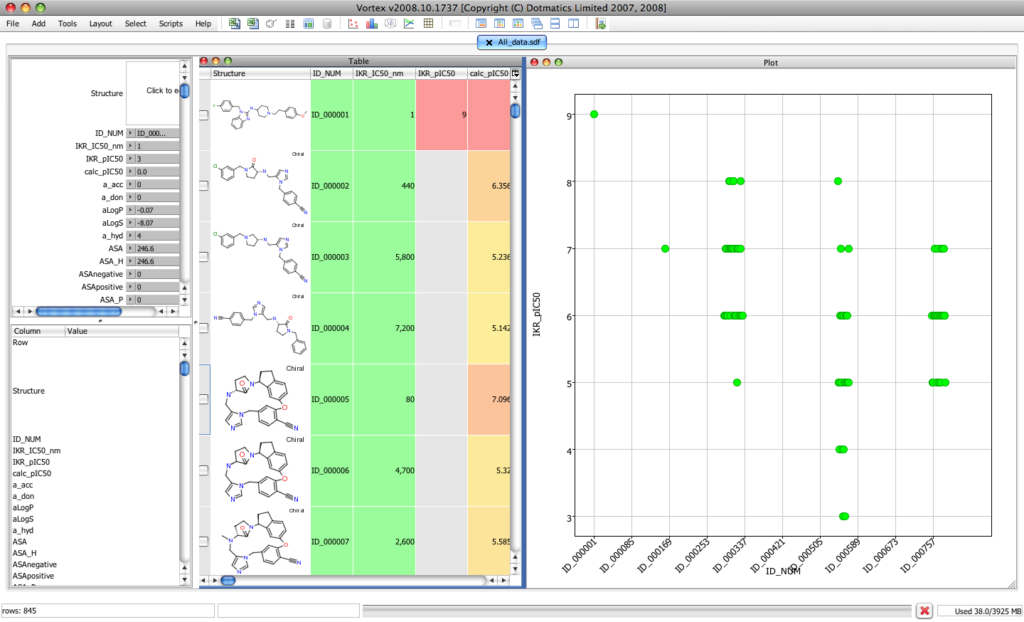
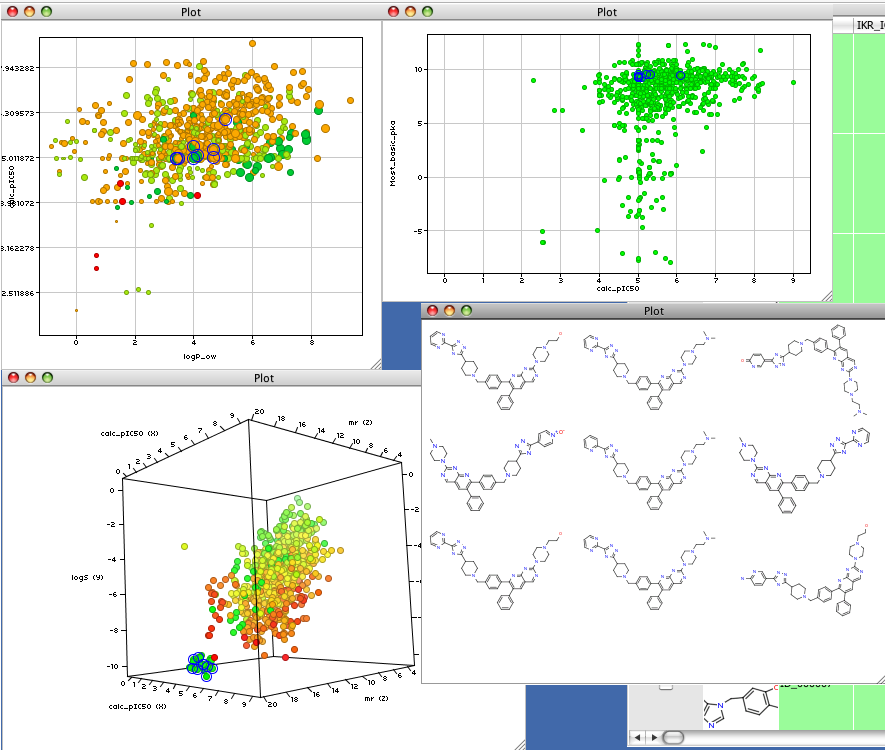
The right hand panel contains a scatter plot, the center panel is a spreadsheet showing the molecular structure and all the alpha numeric data. The upper left hand panel containes a series of slider bars that allow you filter the details of the display whilst the lower panel gives details of the highlighted molecule. The real beauty is that each of the displays is interlinked such that selection of a datapoint in the scatter plot highlights the relevant data in the lower left-hand panel. Each of the panels can be resized or moved to best display the information.
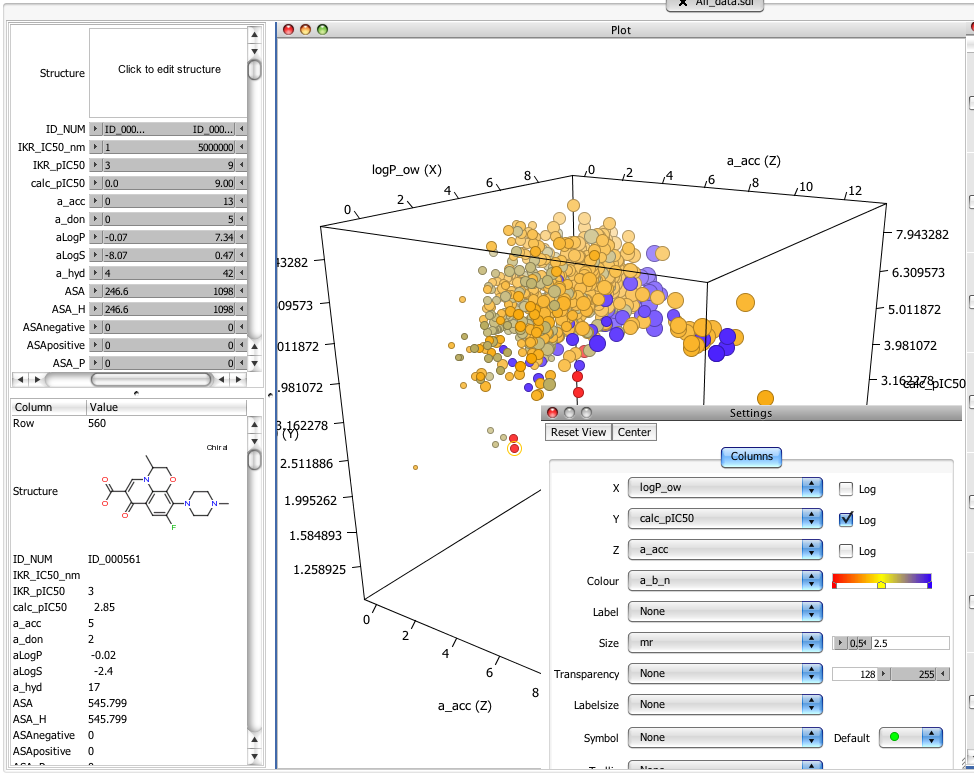
Right clicking on the scatter plot brings up a settings dialog that allows you set x, y, and z axis and conert to a log scale by simply clicking a check box. In addition you can set the size, colour or label to effectively have a rotatable multidimensional display of the data. As you can see the structure and data for the highlighted red point is shown in the bottom left panel. If you don’t have a three button mouse for your laptop make sure you have “Two fingered secondary click” activated in the keyboard control panel.
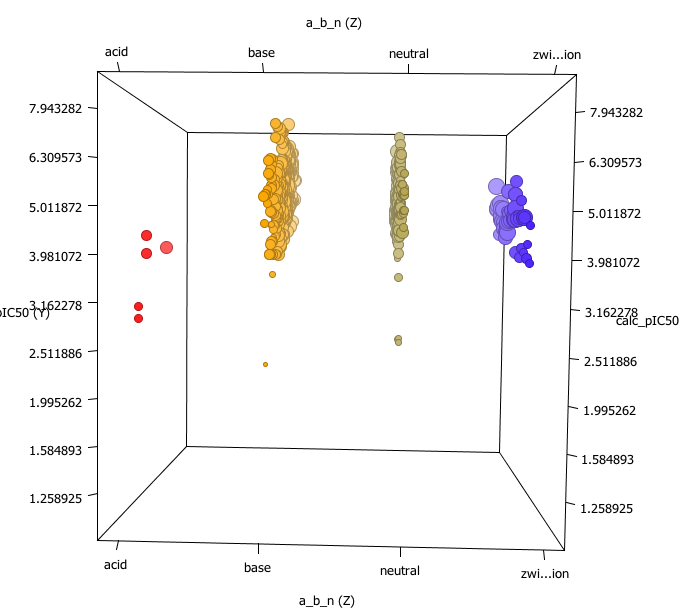
One very nice feature is you don’t only have t have numeric data, this shot shows the Z-axis display a column containing “acid” “base”, “neutral” or “zwitterion”.
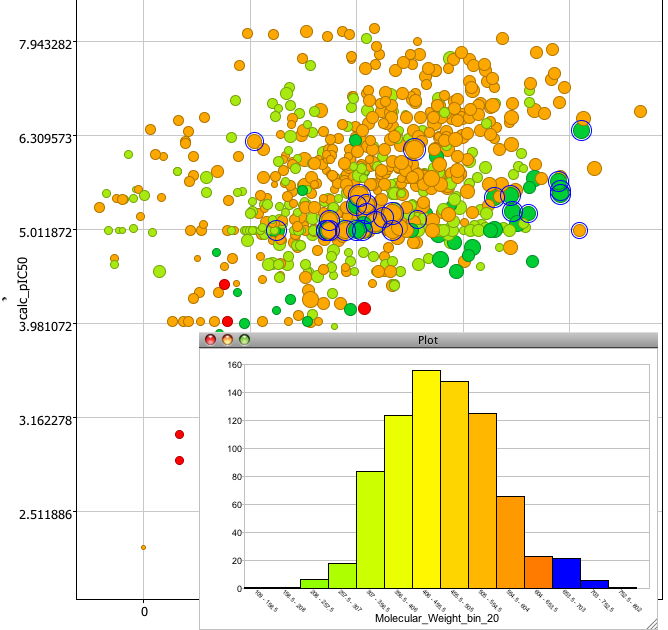
The tools menu allows you to quickly add multiple scatter plots or to add extra columns of calculated chemical data such as molecular weight, various atom type counts, XlogP, a variety of PSA measures etc. These take just a few seconds to calculate and are added to the end of the data table for use in plots etc. You can rapidly look at the distribution of data within a column by selecting the bin option. The results can be displayed either as a bar chart or pie chart. And of course if you select a bar it highlights the corresponding points in the scatter plot.

The top left filter panel allows you to use the sliders to filter out undesired points based on properties in the spreadsheet, but also to undertake sub-structure searches. ChemDraw, Marvin and text based SMILES/SMARTS are supported, structures matching the substructure are highlighted and you can then choose to hide either the sected or unselected points. Searching is instantaneous on a data set of 850 compounds and further testing indicates impressive speed over much larger datasets.
There are many other plots available but tahere are no statistical tools available at present, I have been assured however that they will be added “real soon”, with top priority being given to mean and standard deviations for columns and selected subsets, basic linear regression etc. However the ability to have multiple interactive plots of the data alongside grids of the highlighted structures is an enormous aid to understanding the data.
The work can either be saved in Vortex file format or exported as sdf, excel or csv formats.
Scripting
One feature I only explored a little was the use of the Jython scripting interface to add extra functionality. The following script is a modified version of the applescript I use to get data of CAS numbers, with help from the excellent Dotmatics support this was coverted to the Jython script shown below. The script shows a text area where text containing CAS numbers can be entered. The CAS numbers are identified by a regular expression and the SMILES string for each is returned from pubchem. A workspace displaying the structures and IUPAC names is created.
|
1 2 3 4 5 6 7 8 9 10 11 12 13 14 15 16 17 18 19 20 21 22 23 24 25 26 27 28 29 30 31 32 33 34 35 36 37 38 39 40 41 42 43 44 45 46 47 48 49 50 51 52 53 54 55 56 57 58 59 60 61 62 63 64 |
# Vortex Scripting Example import re, urllib, string textarea = javax.swing.JTextArea() textarea.setPreferredSize(java.awt.Dimension(300,200)) textarea.setText("140-64-7, 64318-79-2") ret = vortex.showInDialog(textarea, "Enter text containing CAS numbers") if ret == vortex.OK: castext = textarea.getText() caslist = re.findall("[0-9]+-[0-9]+-[0-9]", castext) table = vortex.createEmptyTable() smiles_column = table.findColumnWithName("SMILES", 1) cas_column = table.findColumnWithName("CAS", 1) iupac_column = table.findColumnWithName("IUPAC name", 1) for cas in caslist: print "retrieving", cas # build the url getid = "http://eutils.ncbi.nlm.nih.gov/entrez/eutils/esearch.fcgi?db=pccompound&tool=iBabel&term=" + cas # get the url input stream to read the data from #urlis = vortex.getUrlInputStream(getid) urlis = urllib.urlopen(getid) # if the url input stream is null then the CAS number probably doesn't exist if urlis: for line in urlis.readlines(): if string.find(line, "") != -1: start = line.find(">") + 1 stop = line.rfind("<") id = line[start:stop] getsmiles = "http://eutils.ncbi.nlm.nih.gov/entrez/eutils/esummary.fcgi?db=pccompound&id=" + id smilesis = urllib.urlopen(getsmiles) for smiline in smilesis.readlines(): if string.find(smiline, "") + 1 stop = smiline.rfind("<") val = smiline[start:stop] if string.find(smiline, "CanonicalSmile") != -1: smiles_column.addRow(val) cas_column.addRow(cas) elif string.find(smiline, "IUPACName") != -1: iupac_column.addRow(val) smilesis.close() urlis.close() else: vortex.alert("No such CAS number " + cas) vortex.addTable("CAS lookup", table, 0, 4, -1, 0) |
It is easy to see how one might pass the SMILES strings to a web service or Shell script and return some calculated physicochemical property or a predicted biological or toxicological property. The Jython interface should also allow interaction with R for statistical support.
As you might expect from such a new release there are a few minor quibbles, some of the layout of a couple of the 2D structures could be improved slightly but overall Vortex is an absolutely fantastic addition to the growing list of data analysis applications available under Mac OS X, and offer several unique features that make it particularly useful for chemists. Vortex would be invaluable for medicinal chemists for analysis of screening data right through to the lead optimisation stage of a program, and it would be nice if it could be available on every chemists desktop. Whilst Vortex is easy enough for bench chemists to use it would also be very useful for computation chemists.
Updated Version (22 Nov 2008)
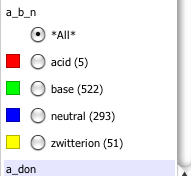
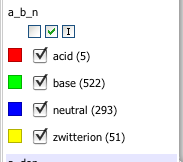
Dotmatics have been hard at work updating Vortex, here I highlight just one feature. Now if you right-click on one of the fields in the left hand selection panel you get a dropdown menu giving more options for selecting or filtering the data.
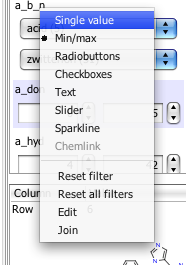
The options now include radio buttons, check boxes, as well as sliders and also sparkline, which is a very nice way to scan through all the data. All of these additions provide additional ways to filter or visualise the data. What is rather nice is that the options shown are only those that are appropriate for the data field. You can also change the colours.
I’ve also written a series of scripts for Vortex that can be found in the Hints and Tutorials and in the performance on Apple Silicon.